Key point: Fixed asset investment drives steel demand; not per capita income
For decades, WSD has been claiming that per capita steel consumption is not the primary driver of steel consumption – it’s the result of other developments. Principally, the main driver is a country’s fixed asset investment (a proxy for Gross Domestic Capital Formation that’s a GDP figure), followed by household expenditures. Household consumption in 2017 was 67% of GDP in the USA, 59% in India and 38% in China.
Steel consumption is measured as a quantity consumed (tonnes) over a period of time (typically a year). Therefore, steel consumption is measured as a rate, or a speed, at which something is happening. The number of people present in a given location has no bearing on this rate; rather, it is the velocity of spending on fixed asset investment and household spending that determines the rate of steel consumption. In other words, how fast one spends capital in the form of FAI or household spending – and its steel intensity – determine how much steel gets consumed at a specific location in a fixed amount to time. While the size of the population reflects the aggregate potential to consume steel, how much steel is consumed per year is purely of function of the velocity of capital. The biggest proof of this situation is that China and India have roughly the same sized populations; yet, they consume vastly different amounts of steel because they deploy capital at vastly different rates.
- China has about 1.4 billion people, with steel consumption about 900 million tonnes per year – or, 0.64 tonnes per capita. Fixed asset investment (FAI) in China is about 44% of GDP of about $11 trillion per annum, or $5 trillion per year. Fixed asset investment – i.e., construction and capital spending – may account for about 92% of Chinese steel consumption.
- India has 1.35 billion people and consumes about 100 million tonnes of steel per year – or, about 0.074 tonnes per capita. Fixed asset investment is about 31% of GDP of $2.8 trillion per year, or about $0.9 trillion per year. Fixed asset investment in India may account for about 85-90% of steel demand (a lower percentage of the total than China because of higher household spending as a share of GDP).
Regarding the USA, it has about 330 million people and consumes about 110 million tonnes per year – or, about 0.33 tonnes per capita (roughly 52% of the figure in China). Yet, USA household income at $47,000 per household is 4.7 times the Chinese figure of about $10,000. In the USA, Gross Fixed Capital Formation is about 18% of its $20 trillion GDP, or about $4 trillion per year. FAI in the USA may account for about two-thirds of steel consumption.
Clearly, China’s fixed asset investment per dollar of spending is far more steel intensive than the USA and India. Steel consumption per $1 trillion of fixed asset investment is about 180 million tonnes in China, 25 million tonnes in the USA and 111million tonnes in India. Here’s another proof of this situation: Chinese rebar production this year may be about 230 million tonnes versus the USA at about 8 million tonnes and India at 25 million tonnes.
China’s high savings rate, at about 44% of GDP (when including households, industrial companies and government), generates far higher flows of funds to its banks, relative to the country’s size, than is the case for the USA with a savings rate at 18% of GDP and India at 31% of GDP.
The Capital Fundamentalism economic theory – that promulgates the benefit of raising fixed asset investment to GDP – is supported by the figures above. One of the factors tied to this theory is the propensity of a country to respond to capital inputs – this phenomenon is called a country’s “social capital.” After World War II, the “social capital” of Western Europe and Japan was so high that relatively moderate capital infusions had high multipliers in terms of the impact on economic activity.
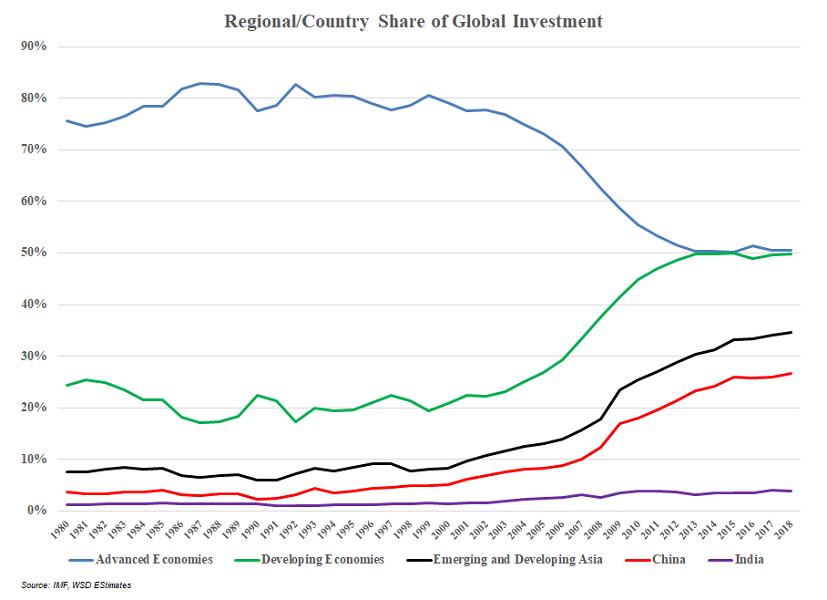
In the accompanying exhibit, based on International Monetary Fund figures, we graph since 1980 the share of global investment for these groups: Advanced Economies, Developing Economies, the combined Emerging and Developing Economies, China and India. The Advanced Country’s share of the total is down from 80 in 1999 to 50% in 2018, with China’s up to about 27% from 4%, respectively.
Looking ahead to the next decade, WSD believes that increasing globalization – reflecting the Information and Technological Revolutions – will lead to increasing “social capital” in many Developing World countries. For example, the Information Revolution has made detailed information so ubiquitous that it’s more difficult for corrupt government officials to divert as much of their country’s funds, to their own benefit.
The Technological Revolution is providing higher returns on capital investment given the often sharply lower operating costs and improved quality at new factories versus existing ones.
Regarding India, WSD forecasts its “social capital” to rise sharply in the next decade. If so, its steel consumption should also be booming. Granted 6% per annum steel production growth in India in the next decade, its steel production in 2028 may be about 192 million tonnes versus about 106.5 million tonnes in 2018.
This report includes forward-looking statements that are based on current expectations about future events and are subject to uncertainties and factors relating to operations and the business environment, all of which are difficult to predict. Although we believe that the expectations reflected in our forward-looking statements are reasonable, they can be affected by inaccurate assumptions we might make or by known or unknown risks and uncertainties, including among other things, changes in prices, shifts in demand, variations in supply, movements in international currency, developments in technology, actions by governments and/or other factors.
The information contained in this report is based upon or derived from sources that are believed to be reliable; however, no representation is made that such information is accurate or complete in all material respects, and reliance upon such information as the basis for taking any action is neither authorized nor warranted. WSD does not solicit, and avoids receiving, non-public material information from its clients and contacts in the course of its business. The information that we publish in our reports and communicate to our clients is not based on material non-public information.
The officers, directors, employees or stockholders of World Steel Dynamics Inc. do not directly or indirectly hold securities of, or that are related to, one or more of the companies that are referred to herein. World Steel Dynamics Inc. may act as a consultant to, and/or sell its subscription services to, one or more of the companies mentioned in this report.
Copyright 2019 by World Steel Dynamics Inc. all rights reserved